Introduction to Residuals in Regression Analysis.
Background Info
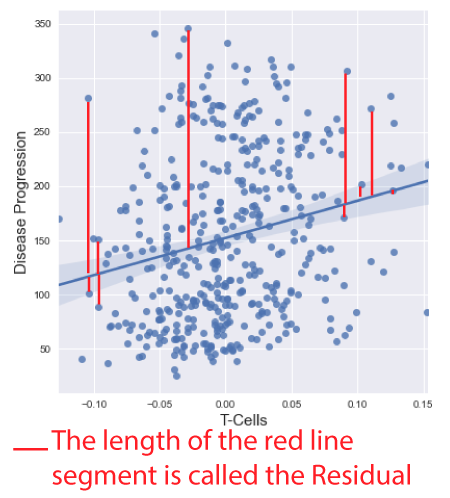
Regressions and Residuals When performing a regression analysis, a line of best fit is formed that attempts to represent the data, and the relationship between the variables in question. Unfortunately, this line does not always perfectly intercept all the data points. If it did intercept at every point, then the regression would be perfectly fit to the data, and this is rarely the case. Instead, we get an estimate of best fit, and the vertical distance between each data point and the line is referred to as the residual, or the error between the actual data point, and the predicted value at that position. In other words, the residual tells ushow off we are in our prediction. Understanding the errors between the predicted and actual values is an important step in any regression analysis, and the goal of this post is to provide an introduction into this topic.
Residuals is the difference between the observed value and the mean value that the model predicts for that observation. Residuals are useful showing how poorly a model represents the data, and more importantly, if the linear regression assumptions are met.
Why is this important?
Residuals is an important concept in regression analysis and is used to generate various diagnostic tools that help determine which type of regression model to use.
- Residual Histogram
- Residuals vs Fitted
- Residuals vs Leverage
The project goals
- Describe residuals.
- Define residuals mathematically.
- Demonstrate how they can be calculated.
- Demonstrate how they are used in graphical diagnostic tools for regression.
Resources & Citations
- Links valid as of 8/23/20.
- Diabetes Dataset.
Methods
Data
- The data for this project was obtained from sklearn datasets.
- The diabetes data is ideal for regression analysis, and contains 442 instances, 10 features, and 1 target variable.
Analysis
The programming language Python was used in this project. The matplotlib and seaborn libraries were used
to visualize the data. Pandas was used to wrangle the data, while numpy and statsmodels
were used in the calculations and machine learning models.